At my company we watch dashboards powered by Grafana, Kibana and OpsGenie. For OpsGenie we use following dashboard with custom modifications. Of course it would be nice to have dashboards always in front of you. Our DevOps team decided to put dashboards on big TV screens hanging on the walls in our room.
First version of screens were running on Linux laptops connected over HDMI cables. That was not scalable, was expensive and required manual support to update Linux, restart laptops, etc.
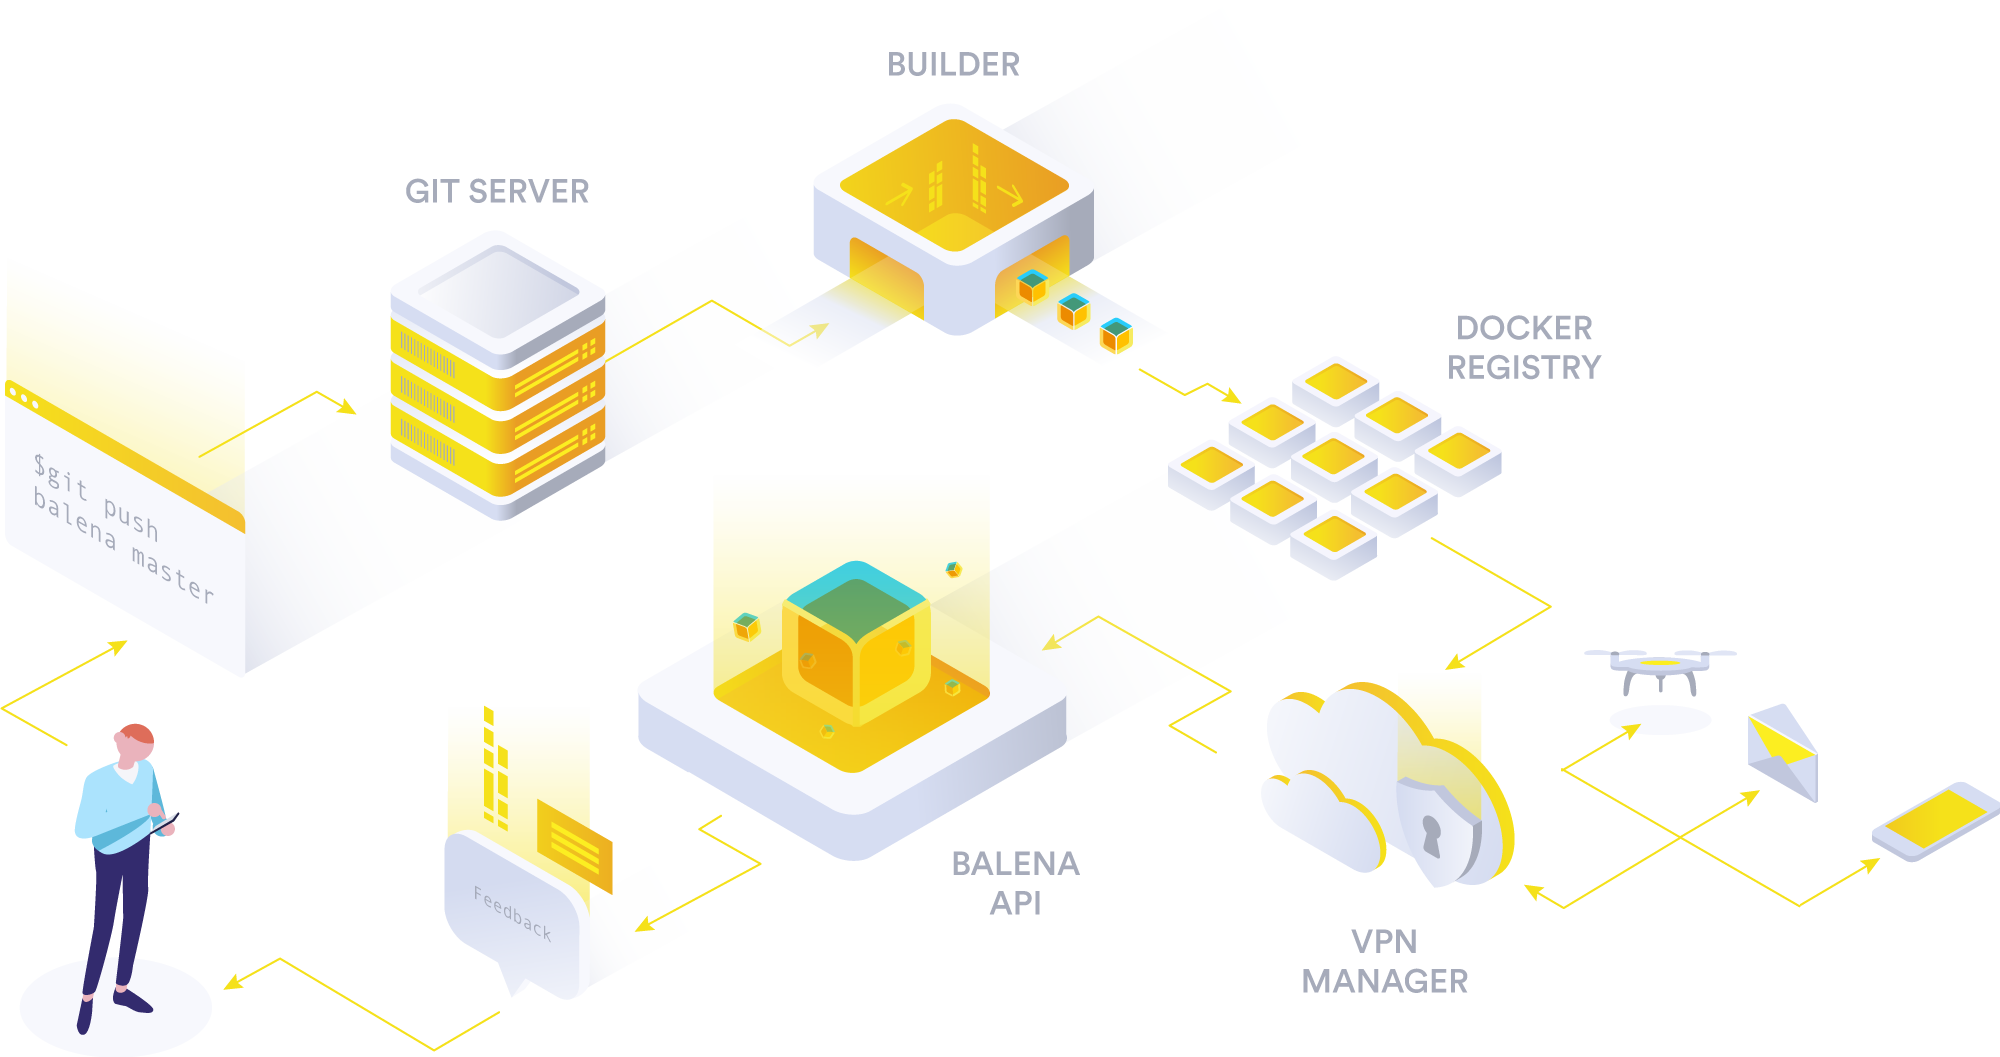
Our boss found a nice project ResinOS. This project (later was renamed to balena) allows to attach Raspberry Pi devices to a nice dashboard, automatically upload and run Docker image on them and manage all of that in an easy and pretty way.
Basically balena provides customized operating system that runs supervisor which task is to get updates of your Docker images pushed to balena cloud, pull them locally and restart container with new changes.
So to prepare a new monitoring screen you need to:
- Purchase Raspberry Pi device and SD card for it. Balena also provides special devices that they build on Raspberry Pi.
- Write Balena OS to SD card.
- Create and setup repository with app that you would like to be executed on your Raspberry Pi.
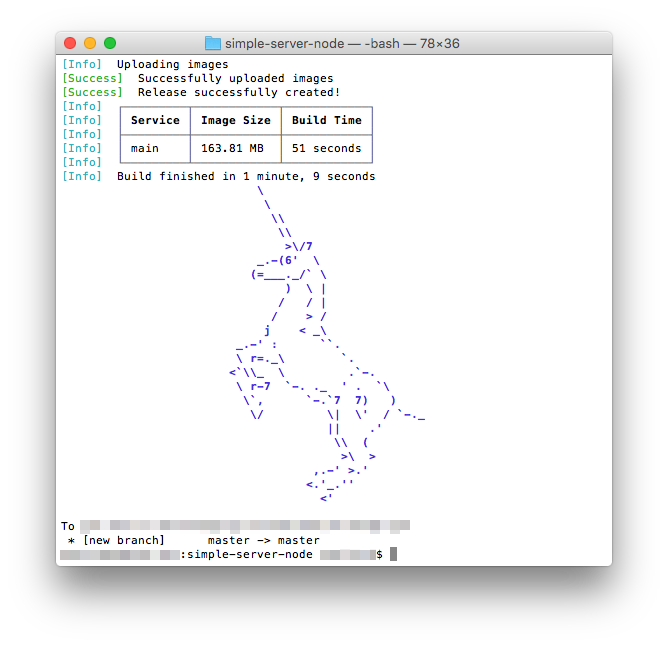
git pushand watch the magic.
Our app is a simple Docker image with X server, Firefox browser and command line tools to resize graphical windows. By the time of this project writing Alpine Linux for ARM didn’t support latest Firefox because of porting Rust issues. Here’s Dockerfile:
FROM resin/%%BALENA_MACHINE_NAME%%-alpine:3.7

RUN apk add --update --no-cache \
  xf86-video-fbdev \
  xf86-input-libinput \
  mesa \
  mesa-dri-swrast \
  xorg-server \
  mesa-egl \
  xf86-input-evdev \
  xdotool \
  bash \
  firefox-esr

ADD profiles.ini /root/.mozilla/firefox/profiles.ini
ADD run /bin/run

# set timezone
ARG TIMEZONE=Europe/Berlin
RUN apk add --update --no-cache tzdata && \
  cp /usr/share/zoneinfo/$TIMEZONE /etc/localtime && \
  echo $TIMEZONE > /etc/timezone && \
  apk del tzdata

## comment out if you don't want systemd
ENV INITSYSTEM on
ENV DBUS_SYSTEM_BUS_ADDRESS unix:path=/host/run/dbus/system_bus_socket

ENTRYPOINT [ "/bin/run" ]
Of course when you have many screens it would be inefficient to duplicate app just to open different web URL in a browser. For that purpose we installed DashKiosk and configured all devices to open the same web link that was a DashKiosk URL. In DashKiosk you manage connected devices to open proper dashboards urls.
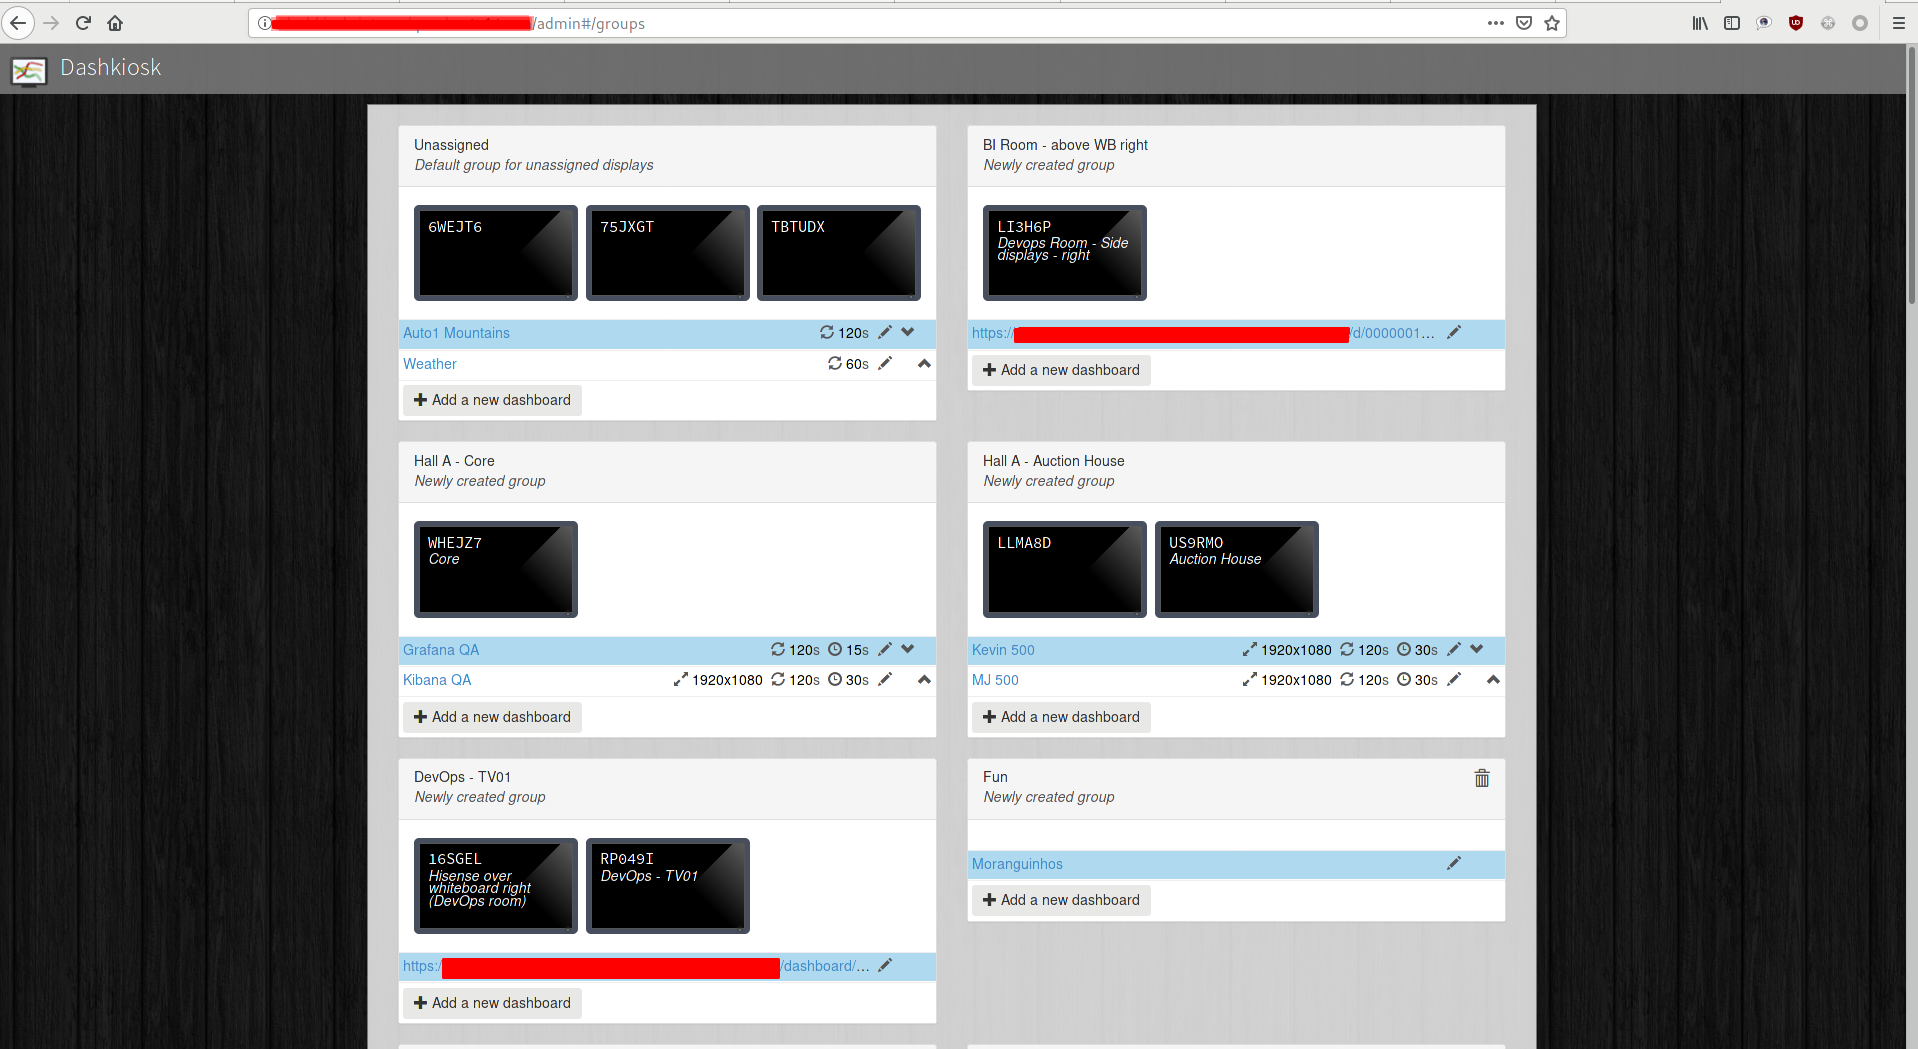
When device is restarted it needs to reconnect to the same URL it was configured before. Because DashKiosk determines device id by browser profile, we need to save it. For that Firefox profile is saved on Raspberry Pi’s SDcard which is persistent storage and data written there survives application and device’s restarts.
Here’s profiles.ini added in Dockerfile above:
[General]
StartWithLastProfile=1

[Profile0]
Name=default
IsRelative=0
Path=/data/firefox-profile
Default=1
And here’s docker entrypoint script. It’s purpose is to
- Get bigger shm device.
- Start Firefox.
- Resize Firefox window, enter full screen mode.
- Sleep forever.
#!/bin/bash
# URL is set in balena device settings
# it should point to dashkiosk
URL=${URL:-http://jodel-app.com}

# By default docker gives us 64MB of shared memory size but to display heavy
# pages we need more.
umount /dev/shm && mount -t tmpfs shm /dev/shm

rm /tmp/.X0-lock &>/dev/null || true

mkdir -p /data/firefox-profile
startx /usr/bin/firefox "$URL" -- -dpms -s off -s noblank -nocursor&
# wait until Xserver and Firefox start
sleep 40
export DISPLAY=:0
xdotool search --name ".*Mozilla Firefox" windowsize 100% 100%
xdotool search --name ".*Mozilla Firefox" key "F11"
# sleep forever
tail -f /dev/null
Once application is ready it’s not the end of configuration. Because latest web tools such as Grafana or Kibana require quite some hardware resources we need to tune balena OS settings to give container more GPU memory and include additional video drivers.
For that please update device configuration or entire fleet with following variables:
RESIN_HOST_CONFIG_gpu_mem=128 sets 128MB of GPU memory, by default it’s only 16MB.
RESIN_HOST_CONFIG_dtoverlay="vc4-fkms-v3d" enables new 3d driver.
That’s it, took me a lot of time to make it work on Alpine Linux.
Result looks like this:
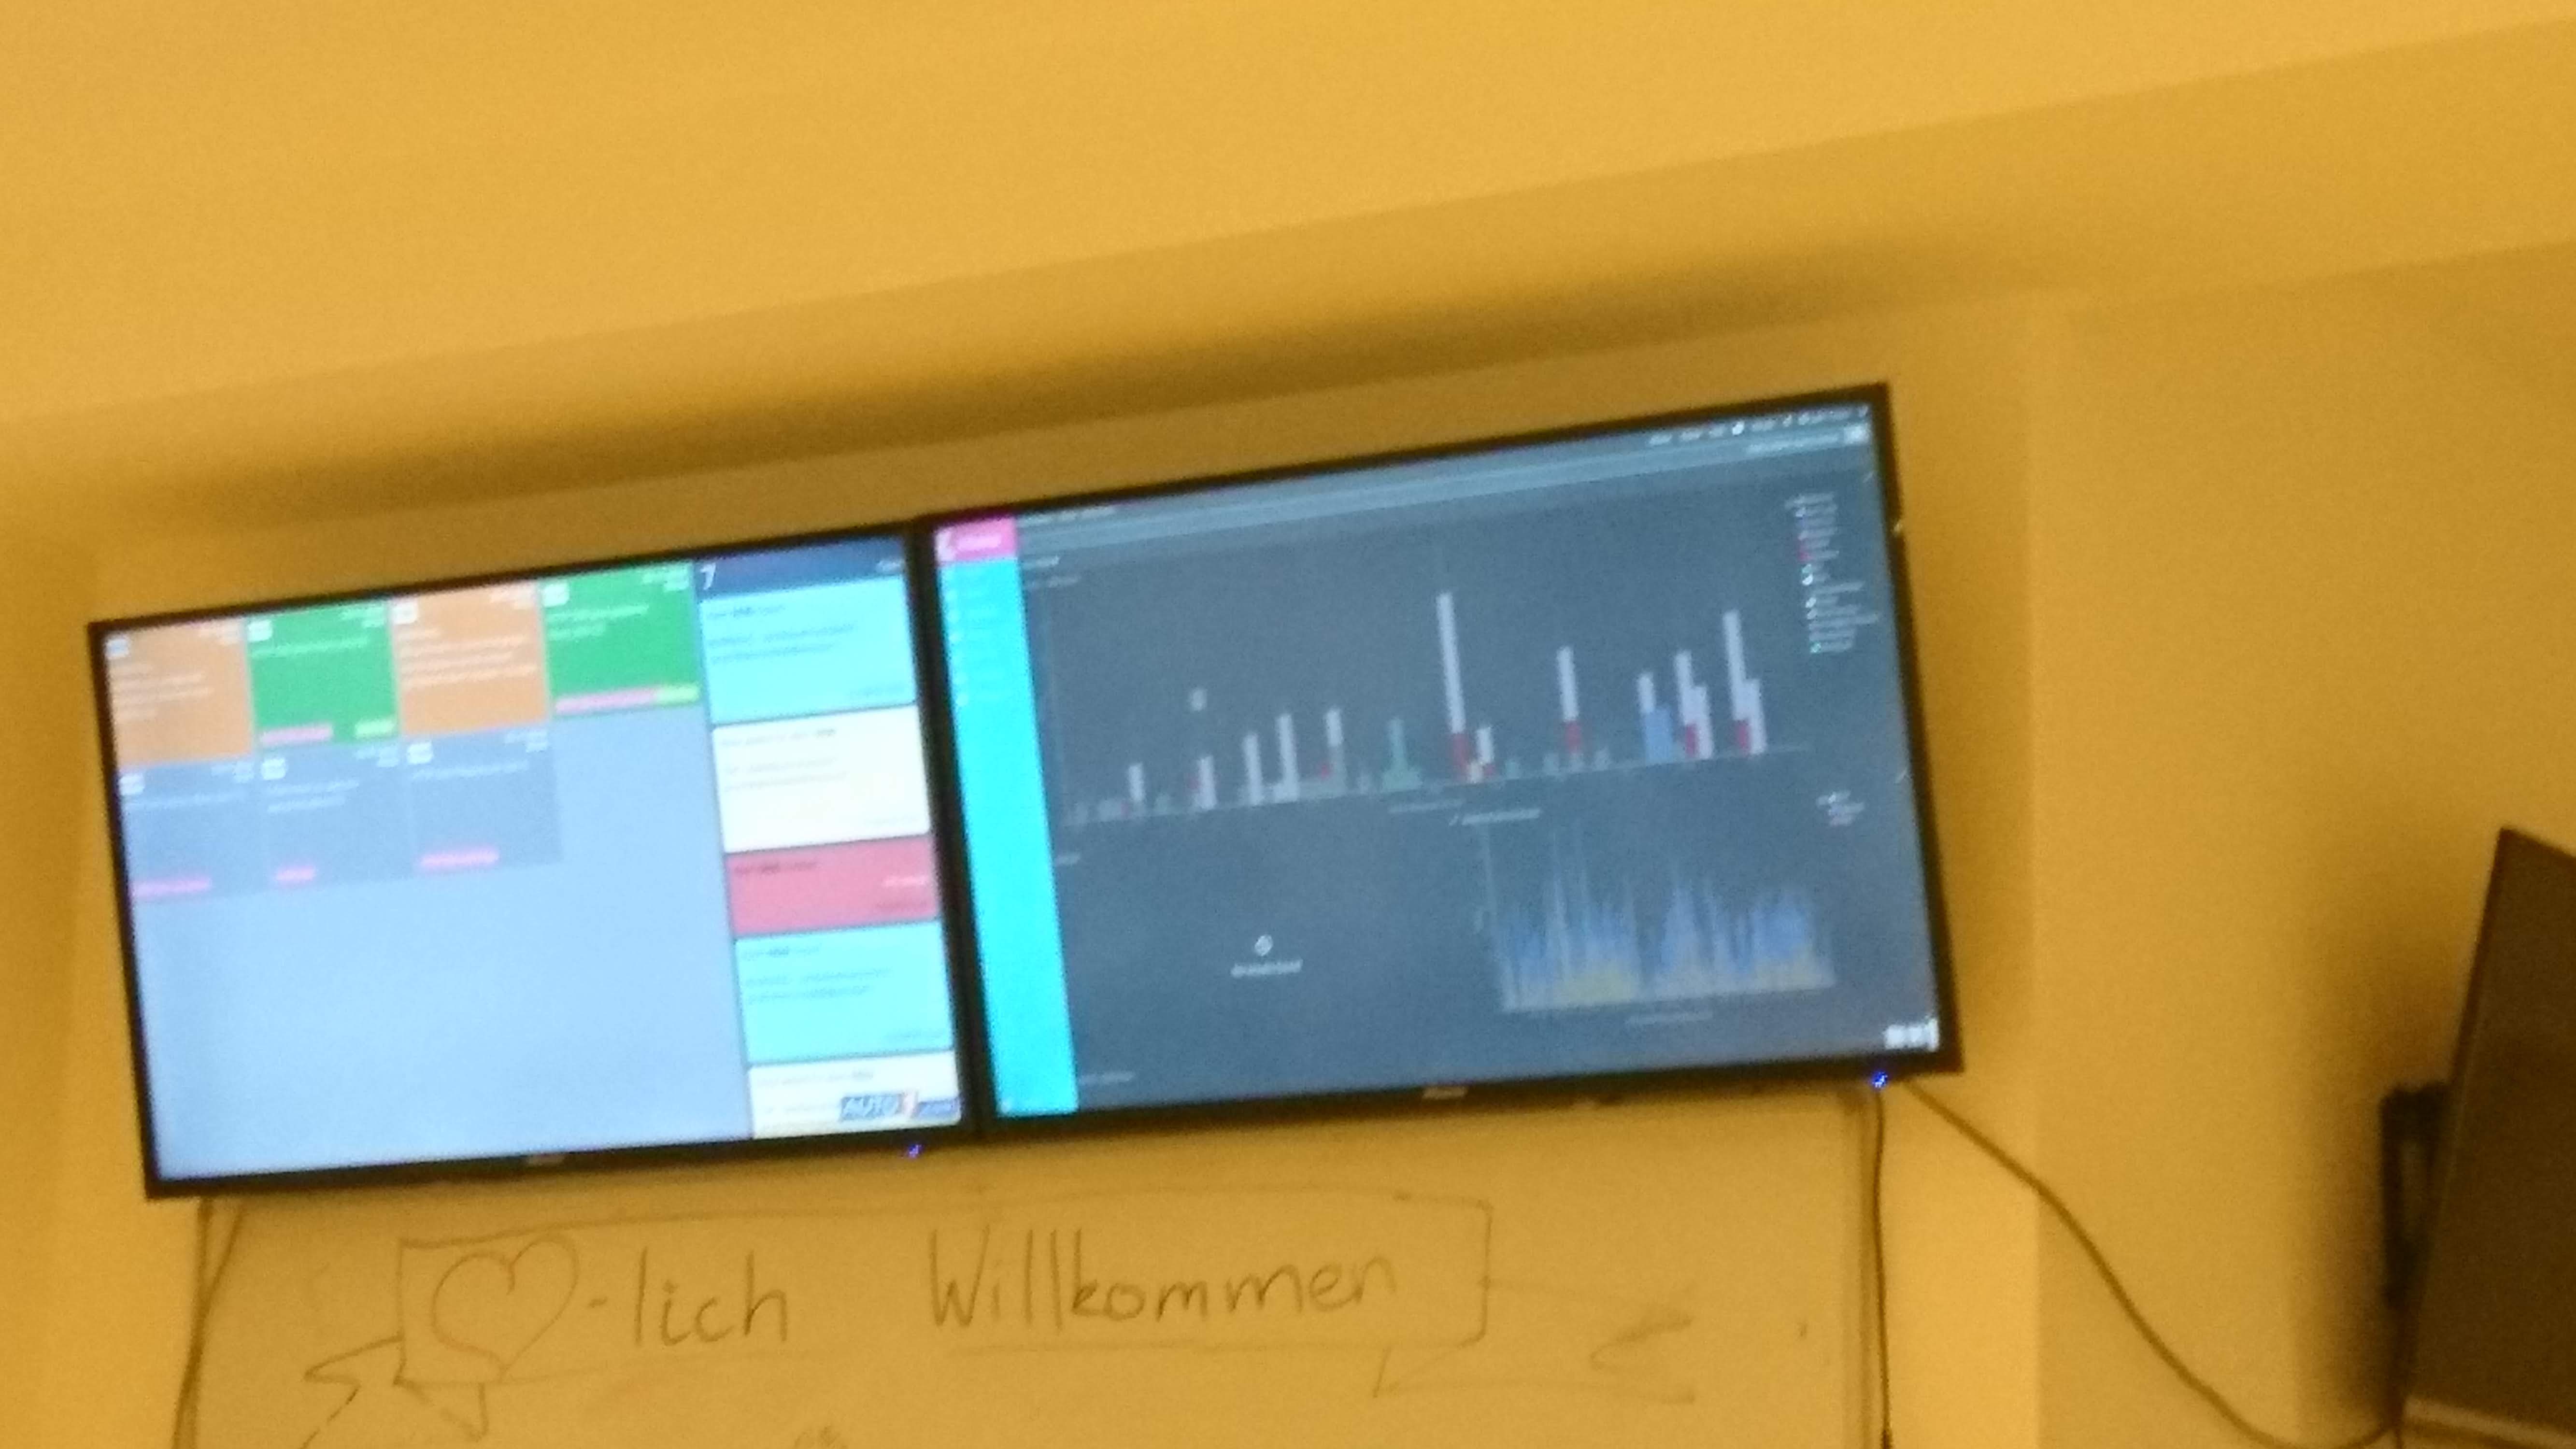
Because of the relatively small result docker image size (280MB vs 450MB with Debian based image) new deployments to balena are quite fast. Hope you will find this article useful and it will save you some time on solving monitoring challenge.
How do you monitor your production systems? What type of alerting and visualization do you use?